Node-RED REST APIs
Node-RED can be used in so many different ways. In this post, lets discuss how to make a REST API endpoint using Node-RED and ODBC.
REST APIs
Rest APIs are a collection of middle-ware services. REST stands for Representational State Transfer, meaning the state of the resource is transferred to the requestor, or endpoint, with no client information retained between calls.
Because this has been covered in a previous post, this post won’t go into detail about how to install Node.js, Node-RED, or ODBC. If you need help, read through the first part of Node-RED with ODBC and Kafka, skipping the part about kafka.
Prerequisite Software
- Node.js
- Node-RED
- ODBC
Additionally, after installing and running Node-RED the following module must be added to your palette
We will start building our flow by adding an ODBC connection to the IBM i. Start by adding an inject and a debug node to the workspace, side by side, and wire them together by dragging a line between them:
One thing you probably noticed that tiny blue dot appears any time you make a change. This blue dot is a notification that you have undeployed changes that will not take effect in your application until you deploy them.
💡 Inject: An inject node is the “trigger” for the flow. It includes a button that injects a message into the start of a flow, meaning any nodes that have been wired to it. A message can be anything - a timestamp, a javascript object, some plain text, or even some SQL.
💡 debug: A debug node prints message contents to the debug pane. These are very useful when building flows in Node-RED. They help you know the exact content of a message as it leaves one of your nodes.
💡 blue dot: A notification that there are undeployed changes.
In order to test our flow, we need to:
- Deploy it by pressing the deploy button
- Click on the debug pane so that we can see the output from the debug node
- Click on the inject node to initiate the flow.
If you saw a message pop up in the debug pane that has a msg.payload number, then SUCCESS. The documentation for an inject node says “The default payload is a timestamp of the current time in millisecs since January 1st, 1970”, and that is what you should see. I didn’t link you to some external help site, because all you need to do to get documentation for a specific node, is to click on the node while the Help pane in the sidebar is selected. Nice!
Adding the ODBC Node
None of the built-in nodes in the palette allow an ODBC connection, so we need to install more nodes into our palette from the open source community.
The steps are:
- Click the menu, then manage palette (or you could just use the shortcut alt+shift+p)
- Click the install tab
- Search for
node-red-contrib-odbc - Click the install button
- Click the install button on the pop up dialogue
The notification at the end says that two nodes were added to palette, ODBC_CONNECTION, and ODBC. Wait, if two nodes were added, why is only the ODBC node now visible in the left hand Palette view? Thats because ODBC_CONNECTION is a special type of node called a configuration node. Configuration nodes are associated with regular nodes, and provide reusable configurability for those nodes.
💡 Configuration Node: A special type of node that holds reusable configuration that can be shared by regular nodes in a flow.
We will discuss the ODBC_CONNECTION configuration node more in a bit. For now, perform the following steps:
- Drag the newly installed ODBC node onto the workspace
- Rewire the nodes so that ODBC is in between the inject node and debug node.
What’s this? A red triangle has appeared on the newly placed ODBC node. The red triangle is telling us there is an error in the node’s configuration. That makes sense, because we haven’t configured it yet. Here is where the ODBC_CONNECTION configuration node comes into play. Node-RED is a bit magical, but not so magic as to guess how the ODBC node is to connect to the database, therefore we must configure it in its associated configuration node.
- Double click on the ODBC node
- Click the Pencil button next to
Add new ODBC_CONNECTION - In the Add new ODBC_CONNECTION config node dialogue, enter
DSN=PUB400for the Connection String. - Click the Add button
- Enter a simple SQL statement, like
Select * from customerin the Query box. - Click Done.
- Click Deploy
- Click on the inject node to initiate the flow.
Now you should be able to see the results of your query in the debug pane. You can expand the carats to see the data being pulled from the IBM i.
Now lets take it a step further. Lets modify the inject node so that it injects something useful, instead of a timestamp that gets thrown away. Our customer table has a numeric key customer_id, so lets inject a key value of 501, and then use mustache syntax on the ODBC node to add a predicate for the customer_id.
💡 Mustache Syntax: Mustache format allows templated data to be passed between nodes in a flow. You can read more on mustache syntax here.
- Double click the inject node
- Change the datatype for msg.payload to number
- Enter 501 for the value
- Click done.
- Double click the ODBC node
- Enter "where customer_id = " as a predicate for the SQL statement.
- Click done.
- Click Deploy.
- Click on the inject node
Adding the Kafka Producer Node
Instead of just displaying the results of our ODBC query in the debug pane, lets now take it a step further and send the data to Kafka, using a Kafka Producer node.
To start, we need to install some Kafka nodes provided by the community into our palette.
- Click Manage Palette on the Menu
- Click the Install tab
- Search for "kafka
- Click the Install button next to @hylink/node-red-kafka-client
- Click Install in the warning dialogue
- Click Close after 3 nodes are installed
Like before, not all of the newly installed nodes are visible in the palette. The Kafka Broker node is a Configuration node that specifies the kafka broker associated with a producer or consumer node.
Start a Kafka Console Consumer
Lets start a kafka console consumer going in the kafka container. A console consumer is one of many kafka command line tools that will print consumed messages from a kafka topic in your kafka broker.
- Go to the kafka image in Docker Desktop and click Open in terminal
- In the terminal that appears, enter
kafka-console-consumer --topic customers --bootstrap-server localhost:9092 - Nothing exciting should happen except for a blinking cursor. This is where any messages sent to the ‘customers’ topic will be displayed. Leave it in this state for now.
Wire it up!
Now that we have a kafka consumer running, lets take the results of our query and send them to our kafka broker in a JSON formatted message. To do so, first we must add a json and a producer node to the workspace, wire them, and then configure the producer and broker settings:
- Drag a parser - json node and a kafka - producer node to the workspace.
- Wire the json node input to the output of the odbc node.
- Wire the output of the json node to the producer producer node.
- Click on the producer node to configure it.
- Click the pencil button next to Add a new broker
- Enter
localhost:29092for Hosts and click Add. - Enter
customersfor the topic name. - Click Done
- Click Deploy
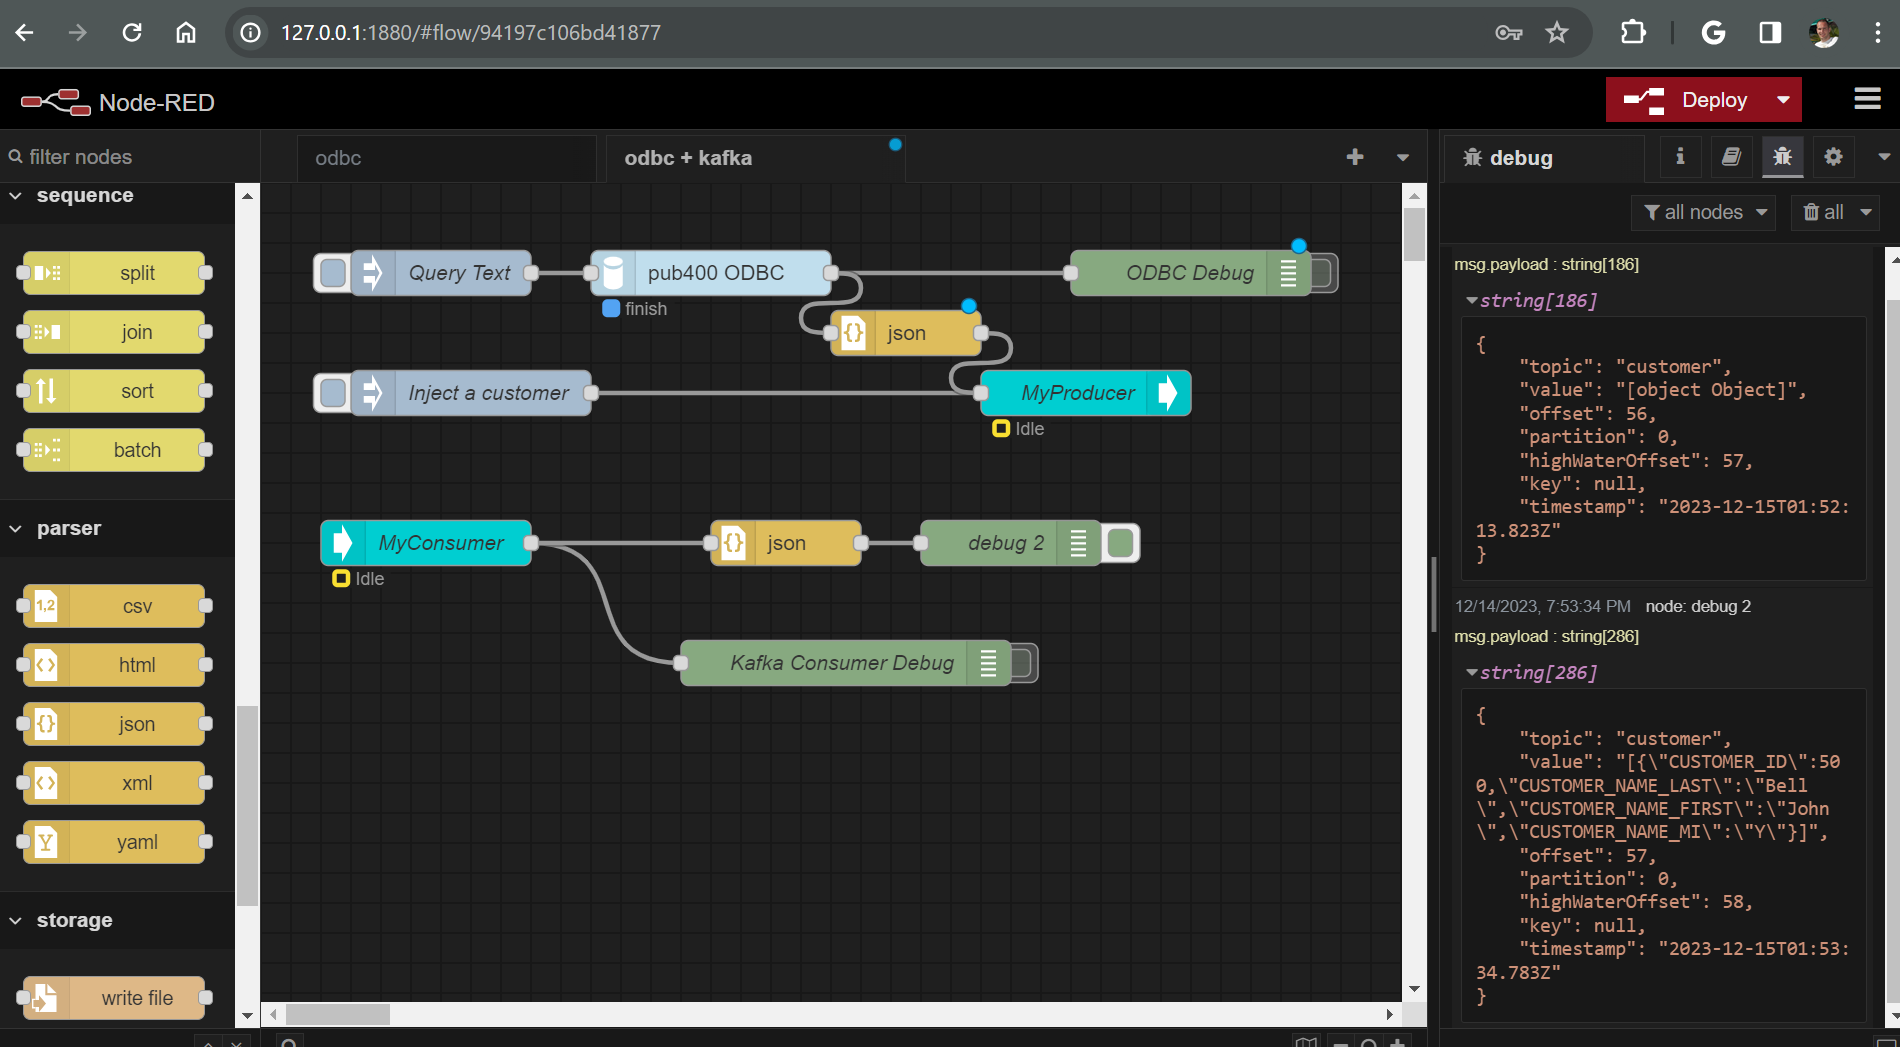
Test it out
Now if you put the Node-RED browser window next to the Docker Desktop kafka terminal, you can see the JSON formatted message produced and consumed when you click on the inject node. For a bonus, try changing the customer id to 502 and producing another message. I’ve hidden the Palette as well as the side pane in Node-RED for easier viewing.
Success! You now have a query running on the IBM i, using ODBC, and are publishing the results of that query to a Kafka topic. Good Job!
Create a kafka consumer flow
By now you are getting used to how Node-RED works. We will start this section by presenting a new screenshot of the completed producer and consumer flow, and then we will talk about each of the nodes.
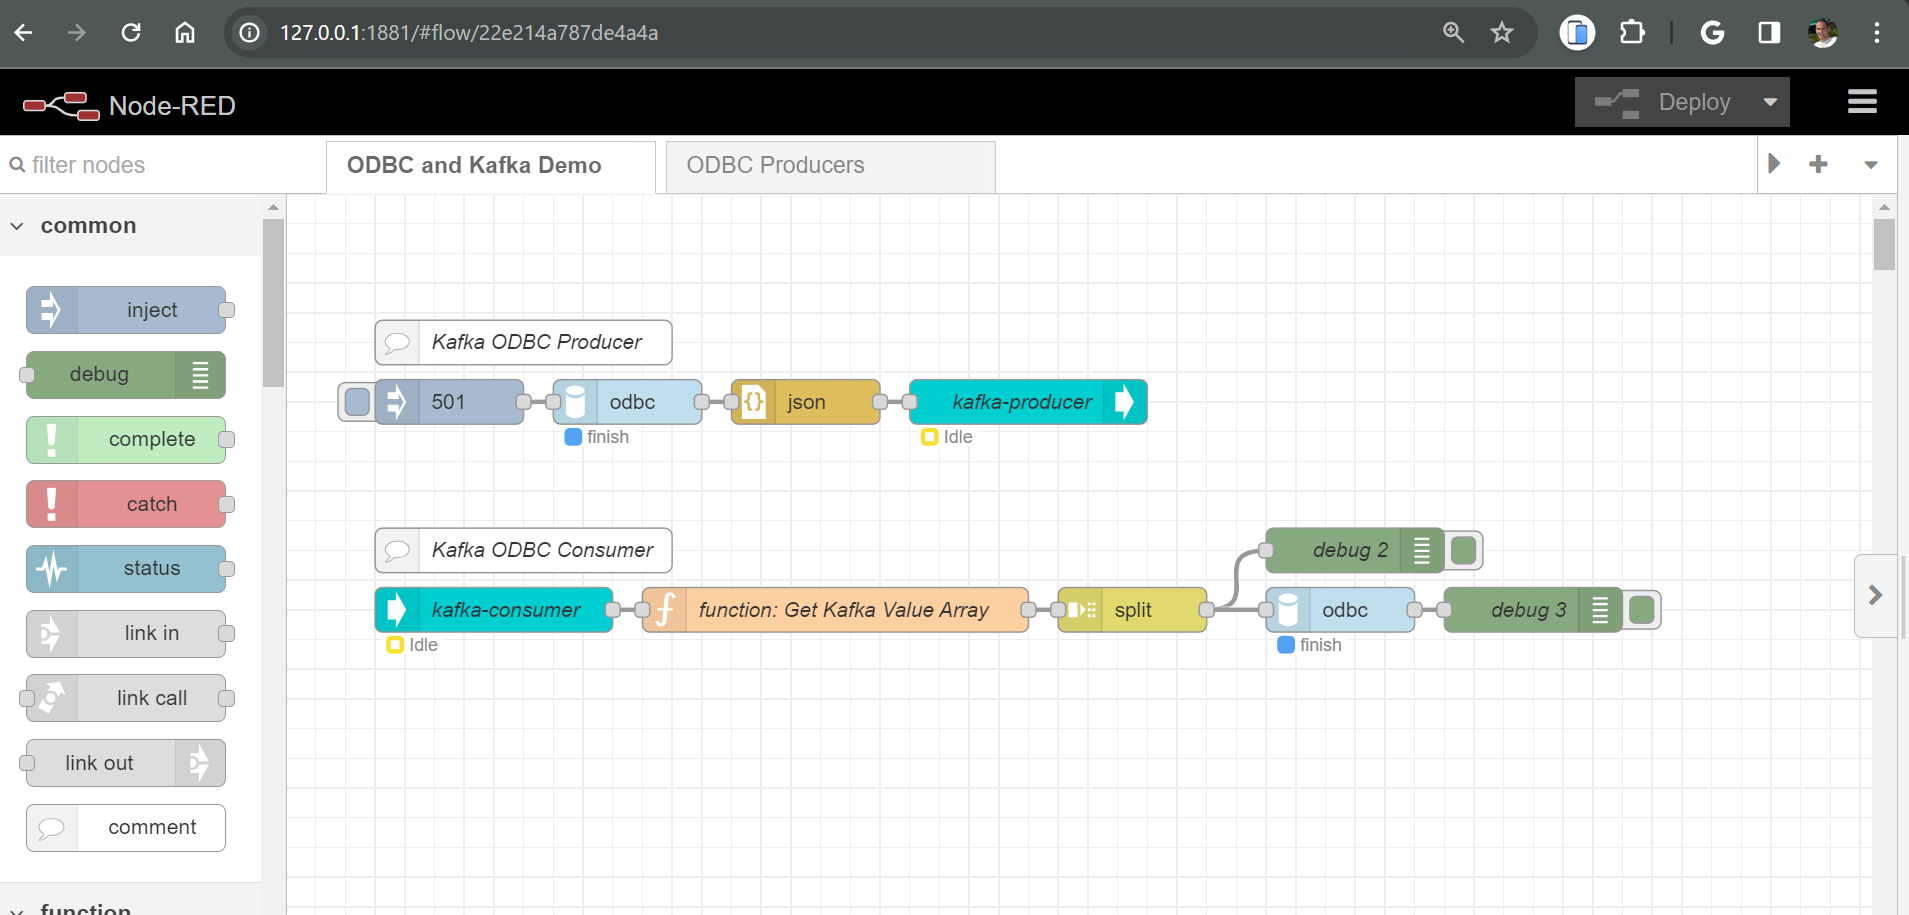
The basic use-case of this flow is a record is read from the customer table are published to a message on the Kafka broker, and then a separate consumer flow consumes the message and writes the same data to another table. This use case could easily be extended to write to a table in another library, another IBM i partition, or even a different kind of database, like Microsoft SQL Server. This same type of flow could be used to replicate the data from one table to another. The possibilities are many. 😎
First, notice that I have added comment nodes to the flow. These comment nodes are just like comments you would use in another language, like rpgle, or c++. They give the developer extra information about what is happening in the flow.
Second, I have removed the debug node from the producer flow and straightened it out a little. Once we have a flow working the way we want, its OK to remove the debug nodes that you no longer need.
Finally, lets discuss the new nodes that were added for the consumer flow: Kafka-Consumer, function, split, debug, odbc (2), and another debug (3).
Kafka-Consumer node
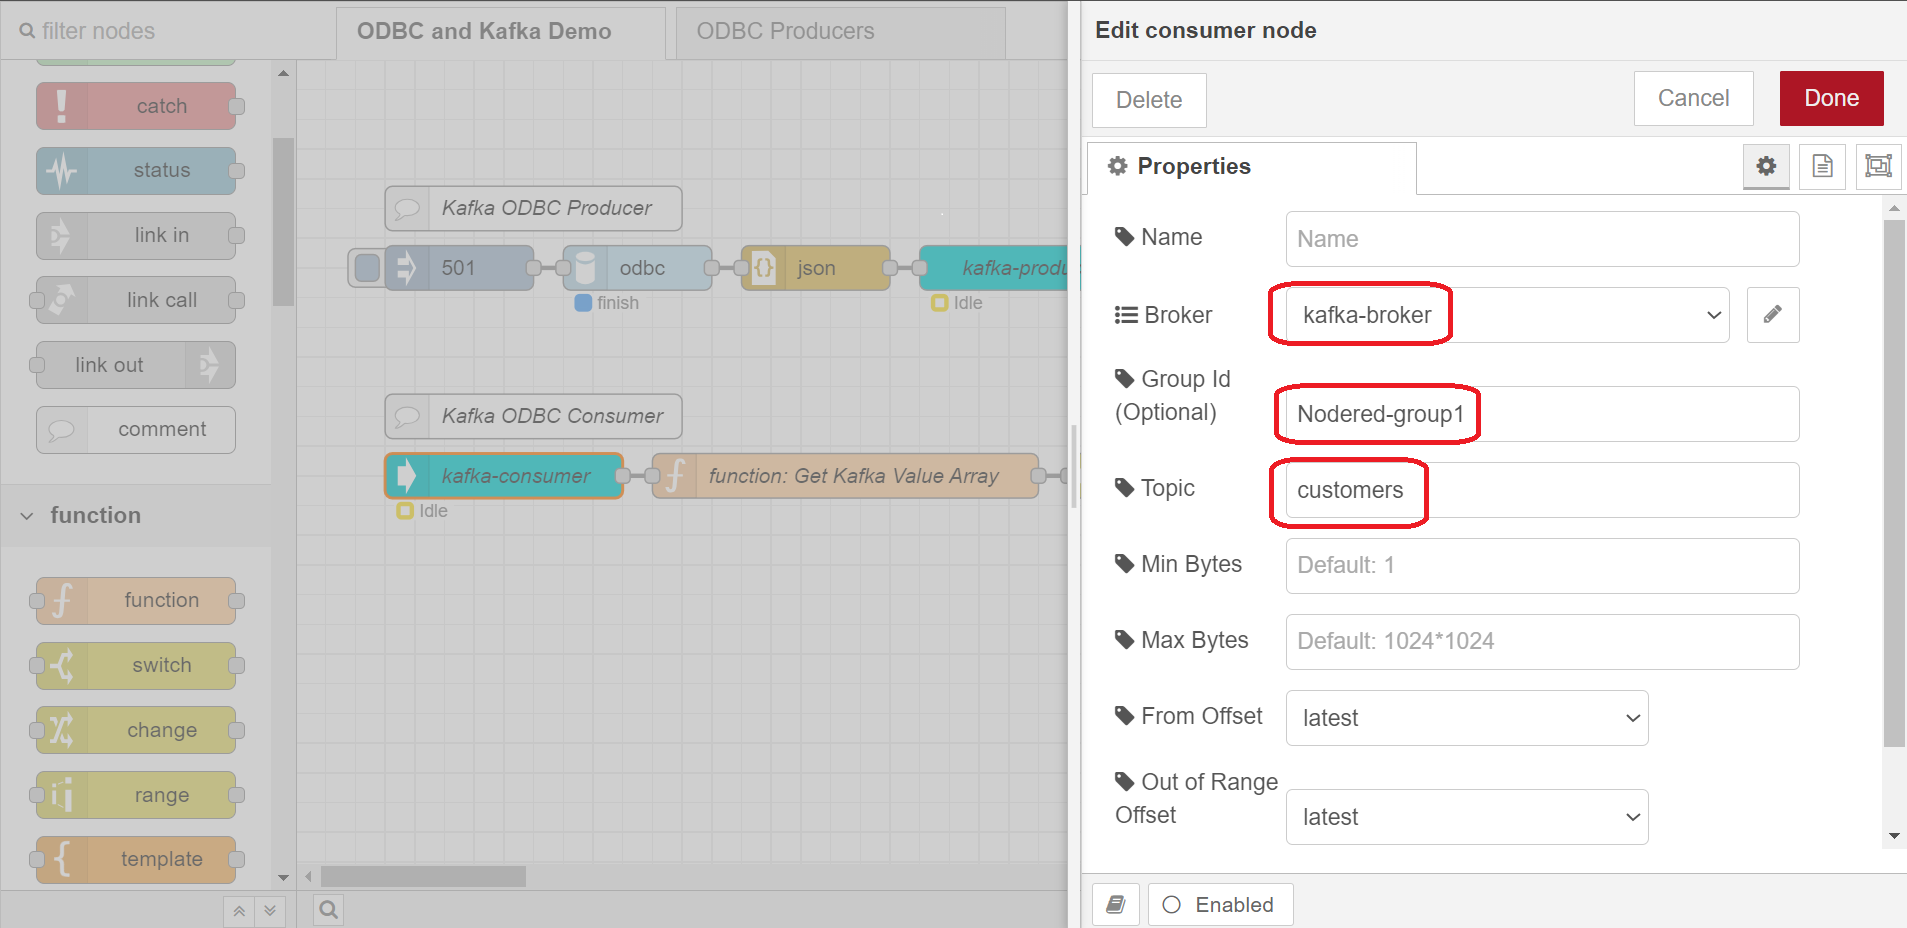
Configure this node to use the same broker that we used in the producer, kafka-broker, give it a Group ID - I used Nodered-group1, and topic should be customers
🔥 Advanced: The Group ID is something specific to a Kafka Consumer - we didn’t specify one for the producer. The reason to specify a Group ID (also called Consumer Group) for a consumer is for cases when you have multiple consumers consuming from the same topic. All consumers in a Consumer Group are meant to perform the same function. The broker by default doles messages out round robin to each consumer in the same consumer group. Messages when produced to a Kafka topic are assigned an offset by the broker. The broker also tracks the offset that was last consumed by a consumer group. Consumer in a different consumer groups would consume the same message offsets, while consumers in the same group do not consume the same offsets - the offsets consumed are unique by consumer group. This is all meant to provide saleability, especially in a cloud architecture.
Closing Summary
Coming soon